In the field of data research, where the main goal is to provide insights based on data, two key concepts serve as guidelines to ensure that our results are trustworthy: sample size and representativeness.
What makes these two concepts so important? Picture this: a pharmaceutical company testing a groundbreaking new drug, its decisions hinging on the outcomes of its clinical trial. With such high stakes, errors are not an option. However, errors are inherent in statistics since we are not testing the entire population but rather a sample (of the population).
If our research is based on an unrepresentative sample, the results may be biased, i.e., they will not reflect the population, leading to actions that are not helpful or may even be harmful.
If a model relies on a small sample, we will find it hard to base our decisions on the results since our sample estimates will have a high variance. Decision-makers will find it hard to trust the data when it is based on a small sample.
In this article, we explore the importance of each of these concepts while providing examples of problems and solutions related to sample size and representativeness.
The Importance of Sample Size in Research
What is Sample Size?
Sample size refers to the number of observations or participants you include in your study from a larger group or population. It’s like picking out a group of people from a big crowd to represent everyone.
Why Does it Matter?
Imagine you’re trying to understand something about a whole population, like all the people in a city. Instead of surveying everyone, which would be hard (or even impossible), you select a smaller group to study—a sample. But here’s the catch: your findings are only as good as your sample size. If you choose too few people, your results might not reflect what’s true for the whole population, i.e., the small sample is unrepresentative and creates a bias, or, it might be representative but with a high variance (i.e., a high degree of uncertainty).
What are The Decisive Factors in Determining Sample Size?
Several things come into play when determining how big your sample should be. One key factor is how much variation there is within the population. If there’s a lot of diversity, you’ll need a larger sample to capture that diversity accurately. Additionally, how confident you want to be in your results (confidence level) and how accurate you want to be (margin of error) also affect the sample size that the research needs. The more confident or precise you want to be, the larger your sample needs to be.
Sample Size Problem Example
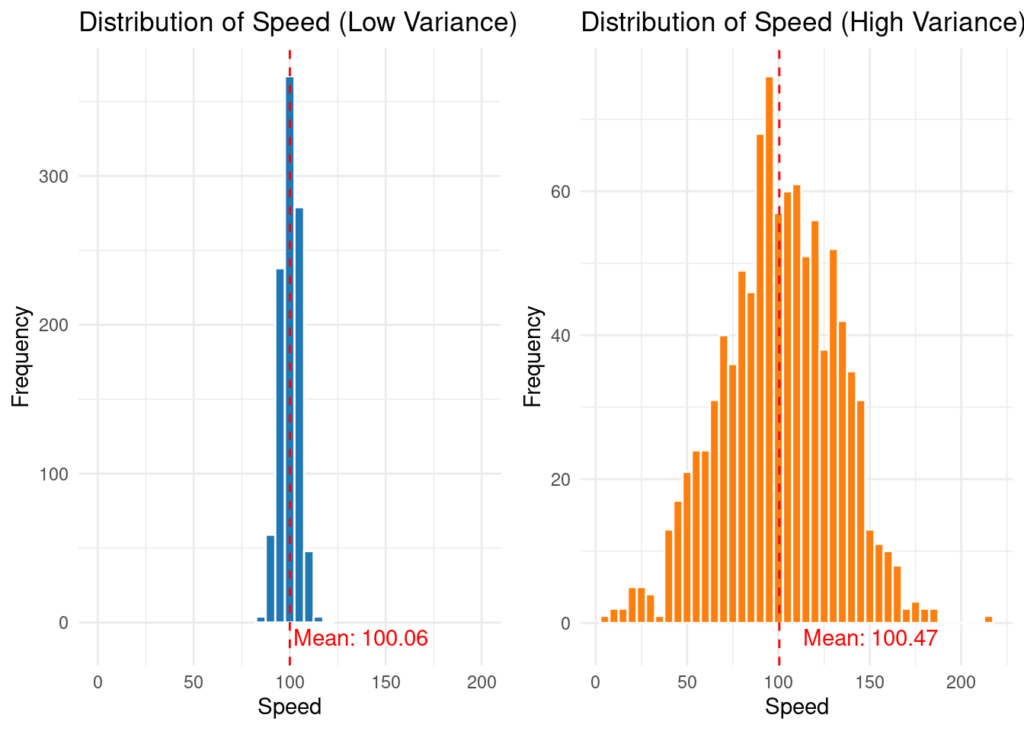
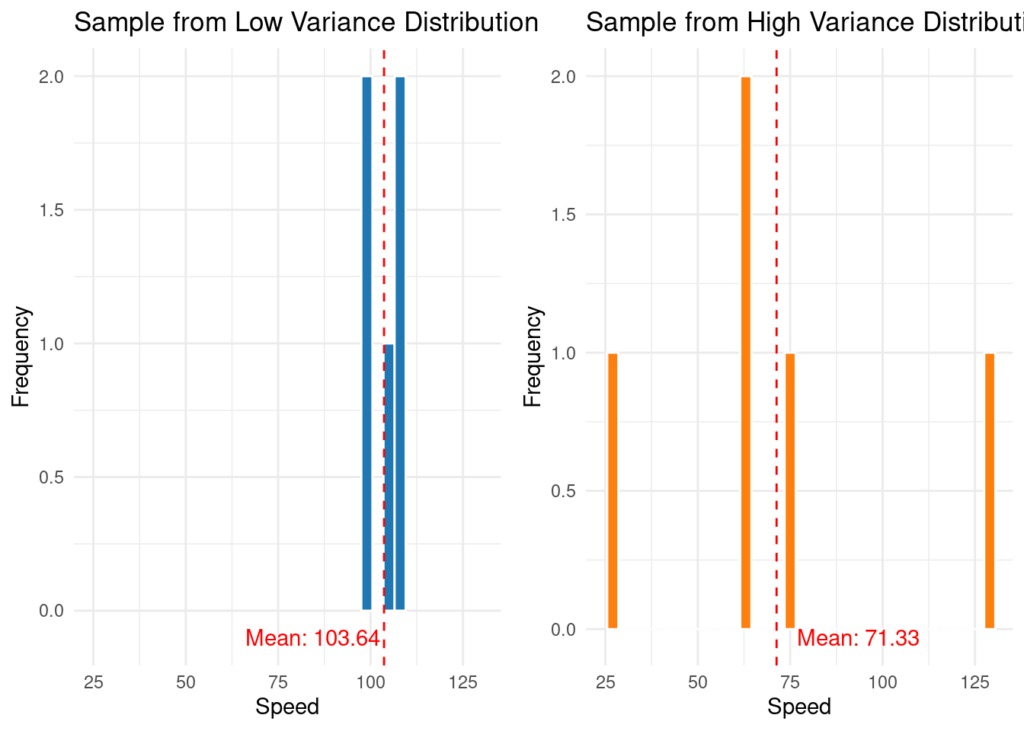
The two distributions shown above have some similarities: both come from a normal distribution with an expectation equal to 100, and both have 1,000 observations. The only difference between the two distributions is their variance. If we choose 5 observations at random from the first distribution (with the low variance), we will get an average that reflects the distribution well. However, if we choose 5 observations at random from the second distribution, we will get an average with a high degree of uncertainty (will probably be an inaccurate estimate).
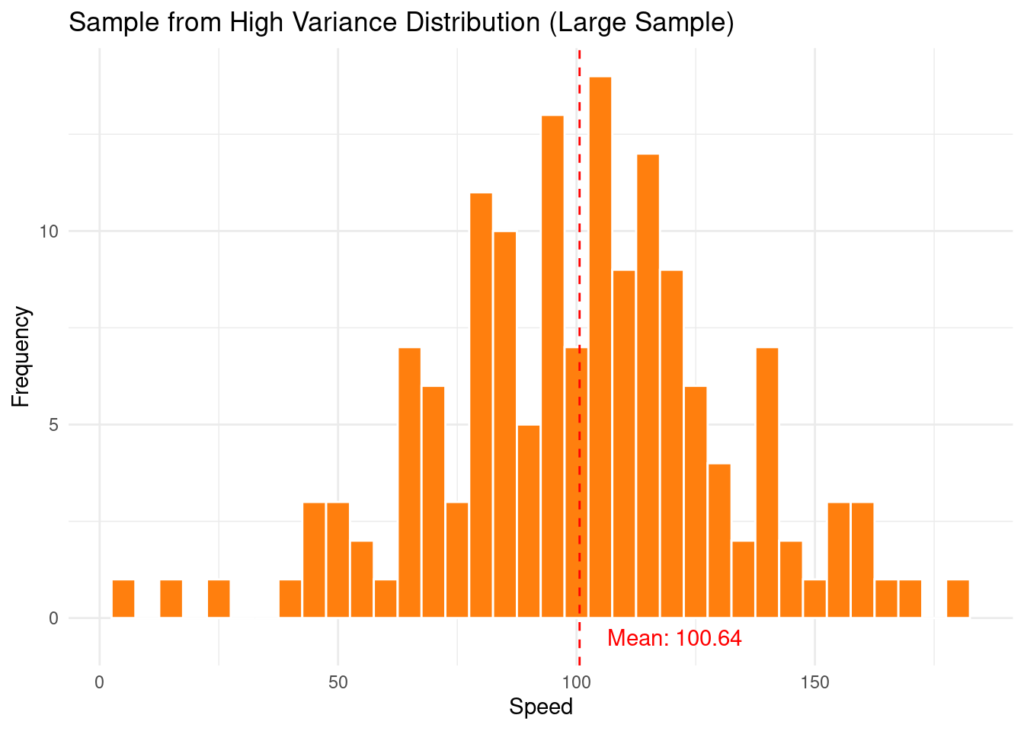
However, if we choose a large enough sample from the second distribution (e.g., 150 observations), we will get a sample that represents the distribution quite well, with a mean closer to the actual expectancy (i.e., 100.64).
Hence, a sample may represent the population from which it is drawn, but to increase the certainty of the results, we must choose the appropriate sample size.
The Importance of Representativeness in Research
What is Representativeness?
In the world of data science and research, representativeness describes how well the group you study (your sample) reflects the larger group it comes from (the population). Think of it like taking a snapshot: you want it to accurately capture what’s happening in the whole picture, not just a certain part of it.
Think about the following image, what does it represent? can you deduce anything about the context of where it was taken?

Scroll to reveal the answer…
If you are familiar with Manhattan during the 30s, you would probably recognize this as a very small part of “Lunch atop a Skyscraper” (see this).

Why Does it Matter?
A famous example of the importance of representativeness in research is the 2016 government elections in the United States. Many polls before the election indicated a high probability of Hillary’s victory, which in the end did not happen. It turns out that the sample did not include enough respondents from certain demographic groups, illustrating the problem of representativeness. As a result, the obtained results were biased from the actual outcome. That’s why a representative sample is crucial—it guarantees (assuming the model is good enough) that your insights are not misleading.
What Influences Representativeness?
Several factors can affect how representative your sample is. One significant factor is sampling bias, which occurs when certain types of people are overrepresented or underrepresented in your sample. This bias can distort your results and present a skewed picture of reality. Additionally, the size and diversity of the population you’re studying play a role. The larger and more diverse the group, the more careful you need to be to ensure that your sample captures all its different aspects accurately.
Representativeness Problem Example:
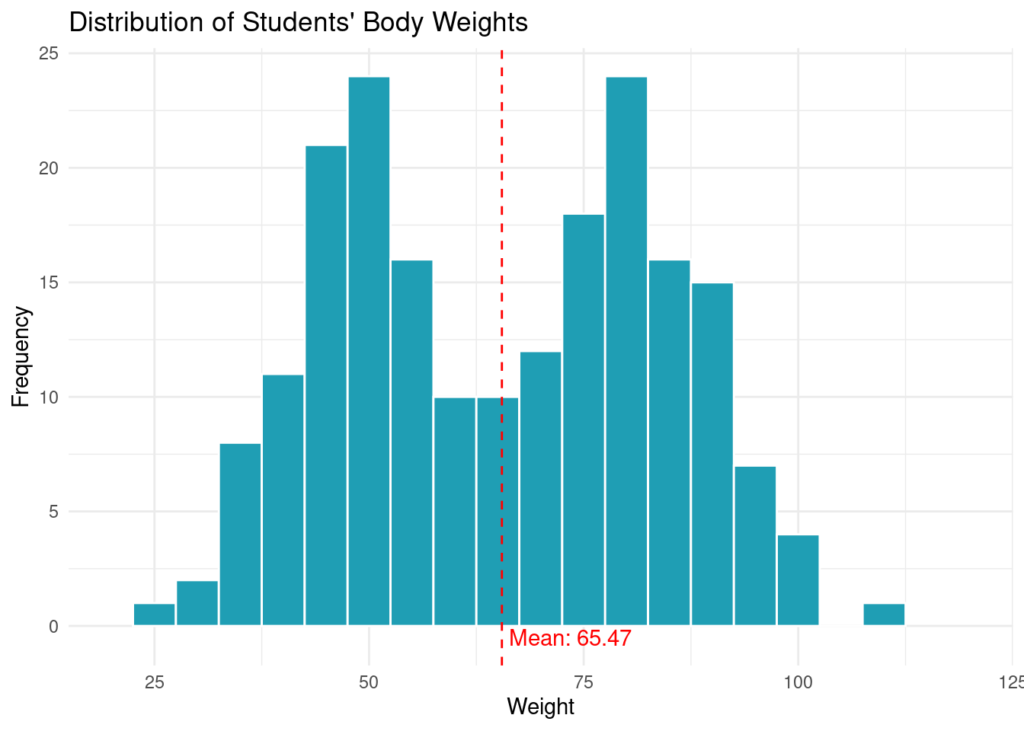
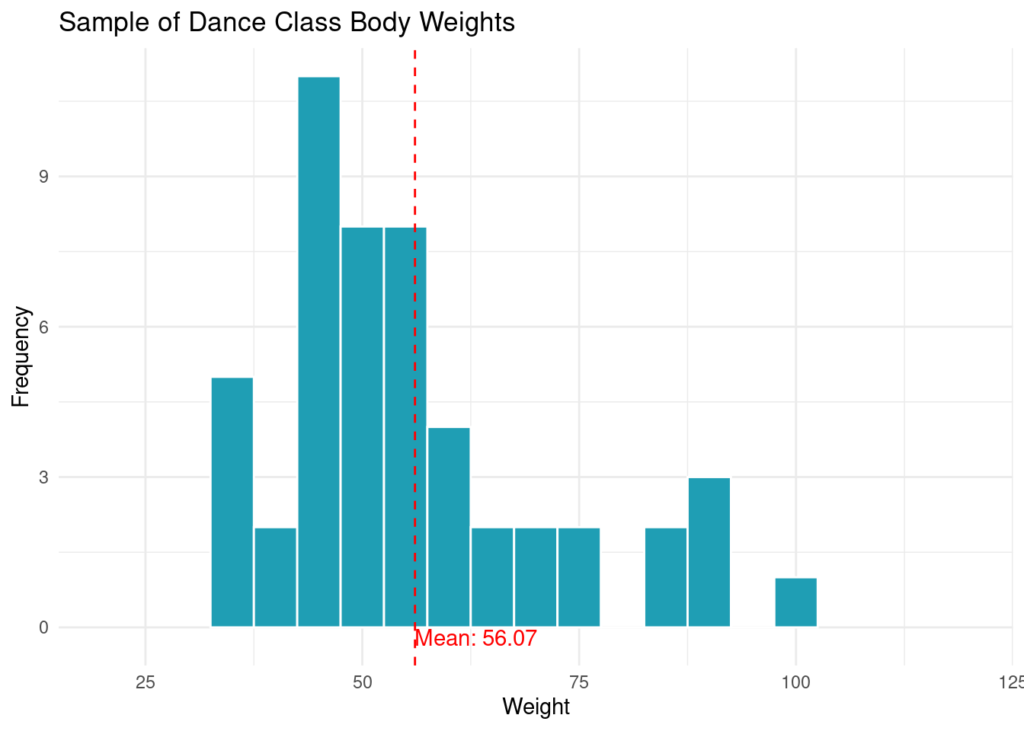
The distribution shown above describes the body weights of a class in a school with 200 students, 100 boys, and 100 girls. Each student can focus on one of the following three areas: Mathematics, mechanics, and dance. Naturally, in the field of mechanics, there are more boys than girls; in the field of dance, there are more girls than boys; and in the field of mathematics, there are an equal number of boys and girls. If we look for the expected body weight of the students in the class while sampling 50 students only from the dance major, we will get a result that is far from reality.
On the other hand, if we take a sample (of the same size) from all majors, considering the proportion of students in each major from the entire class, we will get a result that describes reality much better.
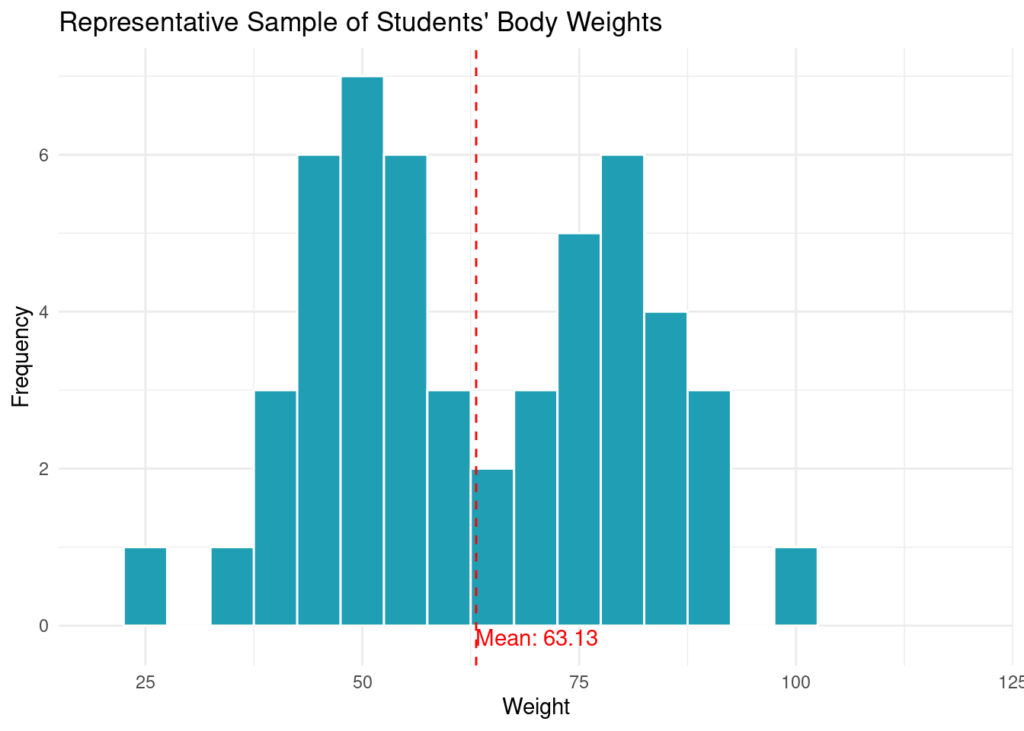
The conclusion we draw is that the nature of the sample is also very important when our goal is to obtain results that reflect the population we are interested in.
Summary
In the field of data research, insights guide organizational actions, and accuracy ensures the correct actions are taken. The two concepts, sample size, and representativeness, play a critical role in ensuring the accuracy and usefulness of research findings.
Limitations in data collection, mainly related to limited resources (time and money), often force us to settle for a small sample of the population. However, to obtain sufficiently accurate results, we must ensure that this sample is not too small.
The examples illustrated above show why choosing an appropriate sample size is essential for obtaining accurate results. A lacking data collection process may result in a sample that does not accurately represent the population of interest.
The examples also demonstrate the importance of examining different sample groups to ensure the results’ effectiveness.
In future blog posts, we will present additional methods for addressing issues such as sample size and representativeness. We will also discuss methods for identifying these problems and strategies for dealing with them effectively. In upcoming posts on our blog, we will delve deeper into this topic, presenting various sampling techniques, considerations for calculating sample size, and strategies for minimizing sampling bias while maximizing the reliability and validity of research findings. Through further discussions on this subject, we aim to provide you with a comprehensive understanding of these fundamental principles, ensuring robust and meaningful data exploration.

