

One of my customers requested that we develop a prediction model and set a goal of being “90% accurate” in our work. This brought forward a discussion of accuracy in machine learning models.
While seemingly a straightforward goal, it’s not that simple. We must first define what we mean by “accuracy in machine learning models”. This is a common situation in our field (see, for example, this post), where data scientists grapple with the various types of accuracy to consider, making our work both intriguing and challenging. As you will see by the end of this post, accuracy is well-defined mathematically but not always the KPI we are interested in.
Understanding the model’s type is crucial in our quest for accuracy. Let us assume that we are using a “supervised learning” model, i.e., a model that learns from a target variable over a sample (a subset of the population) and tries to predict the value of that target variable over the entire population.
These types of models are further subdivided into regression models and classification models:
- Classification models with a binary outcome (either the result of purchasing/not purchasing or the likelihood that an individual would buy our product)
- Regression models have a continuous target variable (like, for example, the amount of money an individual would be willing to spend on our product)
Each model type has a different way of measuring its accuracy.
Errors in Classification Models
In classification models, we can make two types of classification errors. Carrying on with the purchase decision example we used, the two possible errors are:
- Type-1 errors (false-positive): predicting that someone is likely to buy our product when, in fact, he is not.
- Type-2 errors (false-negative): not predicting that someone is going to buy our product when, in fact, he likely is.
These errors have different meanings, and their business impact is context-dependent. For example, if our research is used to base a go-to-market strategy, type-1 errors might cause us to be overoptimistic or even decide on a specific strategy that won’t work and cause us to lose money. Conversely, type-2 errors will cause us to be overpessimistic, perhaps forfeiting the plan altogether and losing potential income.
Depending on the use case (data science, machine learning, healthcare, statistics), many terms are associated with these errors. Two additional terms are sensitivity and specificity:
- Sensitivity is the ability to detect purchase intent.
- Specificity is the ability to detect non-purchase intent.
There is a trade-off between the two. We can increase a model’s sensitivity, which will most likely also increase the type-1 errors (and decrease the type-2 errors).
Additional accuracy-related KPIs:
- Recall: % of correctly identified purchase intents out of total purchase intents (high values indicate the ability to characterize the purchasing population; this is the same as sensitivity).
- Precision: % of correctly identified purchase intents out of total identified purchase intents (low values indicate a lot of “noise”).
- Accuracy (overall, and yes—it’s well-defined in statistics): Correctly identified cases (out of all cases) without relating to the type of identification.
To illustrate, let’s consider the following example: we are trying to identify all the potential customers for contact lenses. In the image, we have:
- Four people with regular glasses
- Two with sunglasses (assume they are not optical and that the individuals have perfect sight),
- The rest (16) are without glasses (assume they don’t have contact lenses and have perfect sight).
We ran a model that identified five potential customers for contact lenses. They are identified in the image with either blue (true positive) or yellow arrows (false positive, type-1 errors).
Our model identified three people with glasses as potential customers (blue arrows), so our recall or sensitivity is 75% (3 out of 4. We missed the guy in the middle between the woman in the green and the man in pink. This “undetected” guy with glasses is a false-negative, i.e., type-2 error).
We wrongly identified two individuals with sunglasses as potential customers for contact lenses, so our specificity is 89% (16 out of 18).
Our precision is 60% (3 out of 5 – blue arrows out of total arrows).
Our accuracy is 86% (3+16 out of 22)

From a business perspective, depending on the context, we might set our threshold to over-identify purchase intents or to be crude and filter out a lot of cases. Our business processes may constrain us in each direction. For example, if we have a lot of bottlenecks from a sales perspective, we might decide to be conservative in our assessments to reduce the noise the sales teams have to deal with. If the sales team is very efficient, we might agree to send a lot of cases, even though many of them will turn out to be negative (will not convert to purchase).
Errors in Regression Models
For example, the accuracy in machine learning regression models, can be measured by the mean absolute percentage error (MAPE), the root mean squared error (RMSE), the mean error (ME), or other KPIs to measure the error.
Each of them has a different emphasis:
The mean absolute percentage error would yield the average prediction error, in percentages, without considering the direction of the error (upwards or downwards; we only consider the “size of the error”).
In contrast, the root mean squared error would emphasize larger errors over minor errors since all the errors are squared (i.e., brought to the power of two). By the way, in case you ran into “linear regression” in your undergrad studies (OLS, Ordinary Least Squares), it uses a similar measure (the sum of squares) to compute the model. The last KPI I mentioned (the mean error) is a KPI rarely used because it can show an error of “0” (on average) but with significant deviations in effect (a model that, on average, hits right on point but is never on point and is far away from it).
So, 90% accuracy in MAPE is not the same as 90% accuracy in RMSE. One might be achievable, whereas the other might not.
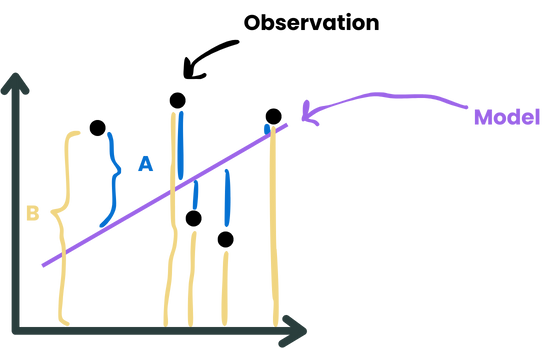
Illustrative example:
The MAPE would be mean(|Ai|/Bi) (averaged over all points)
The RMSE would be Ai2 (summed over all of the points and then taking the square root)
Accuracy takes on a completely different meaning when dealing with regression models.
So, next time you think about accuracy, be specific. What type of accuracy are you talking about?